tVNS Connect
Transcutaneous Vagus Nerve Stimulation (tVNS)
An app designed to visualize a patient’s treatment progress with tVNS Devices and provide insightful, medically relevant information that can easily be shared with their physicians.
The Challenge
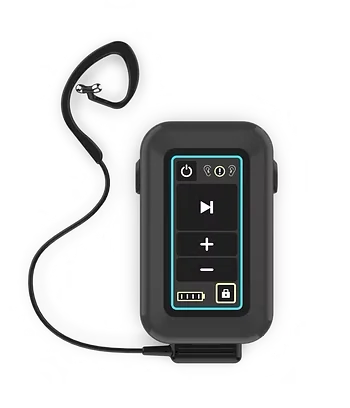
tVNS Technologies needed a companion app for their medical device, a hardware-first product with no interface, leaving patients with no visibility into their own treatment. Leadership’s initial vision was a settings dashboard. What began as a dashboard brief evolved through research into a broader patient-facing experience.
The Work
1. Discovery & Research
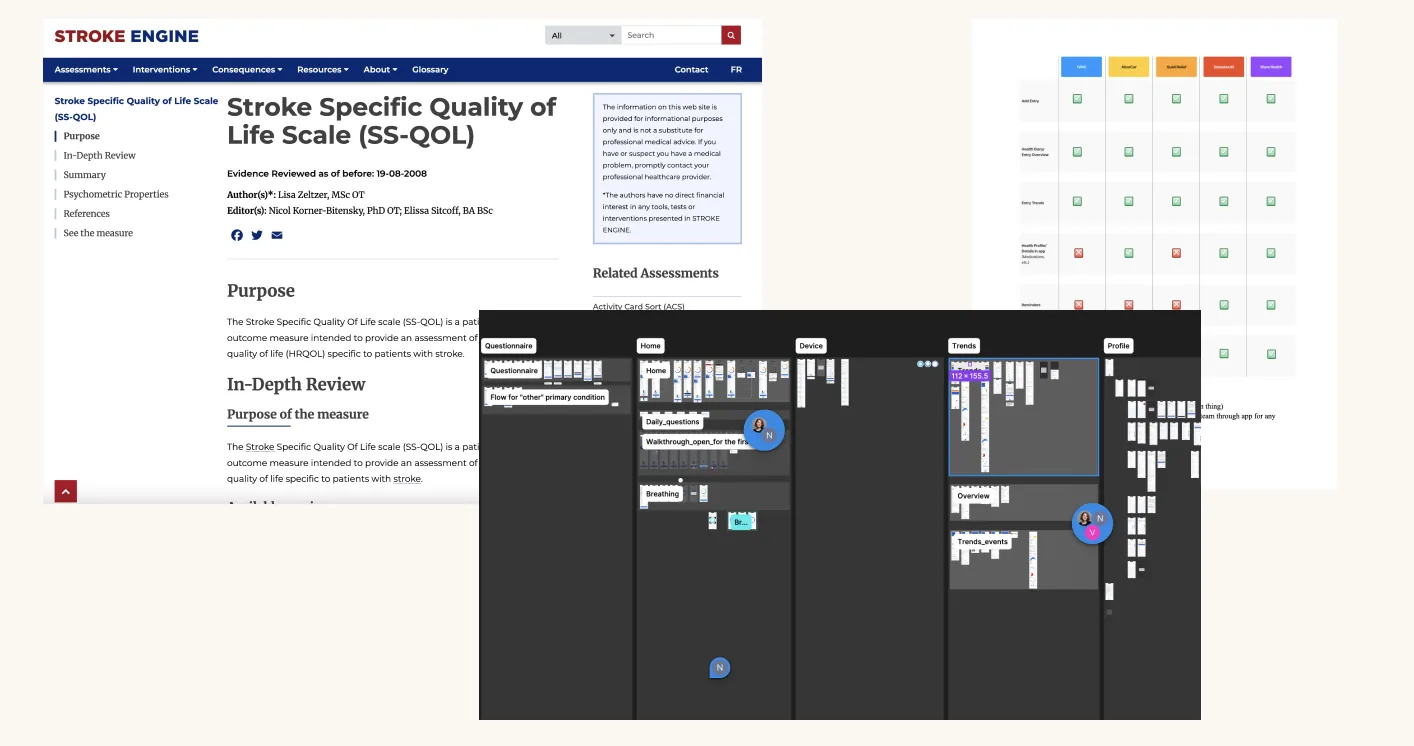
Before writing any requirements, I ran patient surveys and opt-in user interviews to understand their behavior. I found two things. Patients weren’t using the device consistently, and they had no meaningful way to see whether it was helping. This became the foundation for everything that followed, and gave me the evidence I needed to pitch beyond the original dashboard brief.
2. Clinical Input
To ensure the app captured relevant and accurate data, I consulted physicians and researchers treating the indications the app was being built for. I wanted to understand what improvement look like in their patients and what they would want to see in a report. Their input shaped the symptom-tracking questionnaires, onboarding flows, health metrics, and all in-app health information.
3. Development & Delivery
I led an offshore development team using agile practices, structuring sprints around segments of the user journey. Weekly standups kept requirements clear, made blockers transparent, and aligned the team on logic and use cases. JIRA and Confluence served as our single source of truth, housing product requirements, user research, and clinical reference material accessible to both the internal and dev teams.
The Results
The final app included the original device dashboard leadership had requested and a patient-facing layer built entirely around the research findings.
The Statistics Page, the core of the expanded scope, gave patients a visualization of their own progress over time. Patients could log symptoms, events and triggers specific to their condition, alongside quality-of-life indicators like sleep, mood, anxiety, and physical activity. Over time, these data points generated charts that made improvement visible and easy to understand for both patients and caregivers.
Patients using the updated app showed increased adherence to treatment and higher satisfaction scores. Caregivers and physicians also benefited from having shareable, structured progress data that made conversations at appointments more productive and grounded.
The app is now available for iOS and Android users in most European and Asian countries.
← Back to work